Planner Release Notes V1.12
Release 1.12
🔍 Lookup tables have arrived!
It's really common to have some kind of table containing amounts or factors that vary based on some well attributes. For example, it's convenient to list cost assumptions for all possible well types, then look up those costs per well based on its type.
Until now, everyone kept those tables outside of the Planner, and instead imported already-looked-up values per well. That's not ideal though: it means you still need to maintain an Excel file somewhere and make sure to sync it up with the Planner as assumptions change.
Release 1.12 makes this much easier by being able to add or import lookup tables directly into your plans. Here's what that looks like:
|
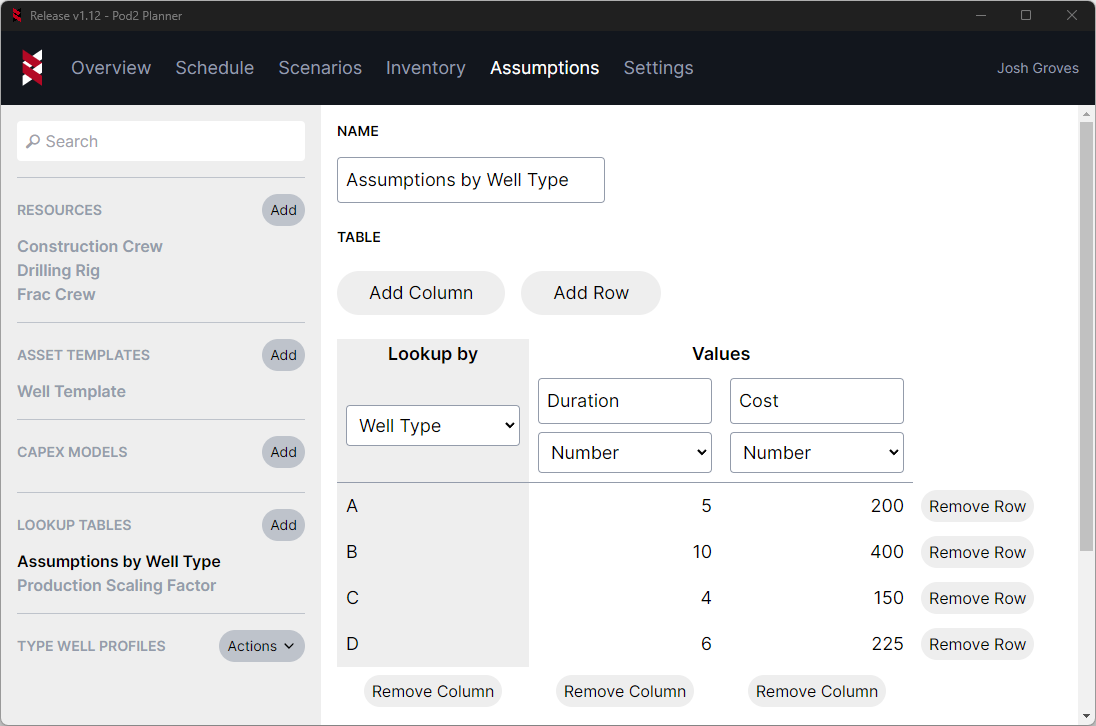
Lookup tables contain lookup columns (any columns with a grey background on the left side of the table) and value columns (all other columns). Lookup columns are text or number attributes you'd like to use when trying to find matching rows (e.g., "well type", "lateral length", "frac stages"), while value columns are the values that you want to look up (e.g., "frac cost", "drilling duration").
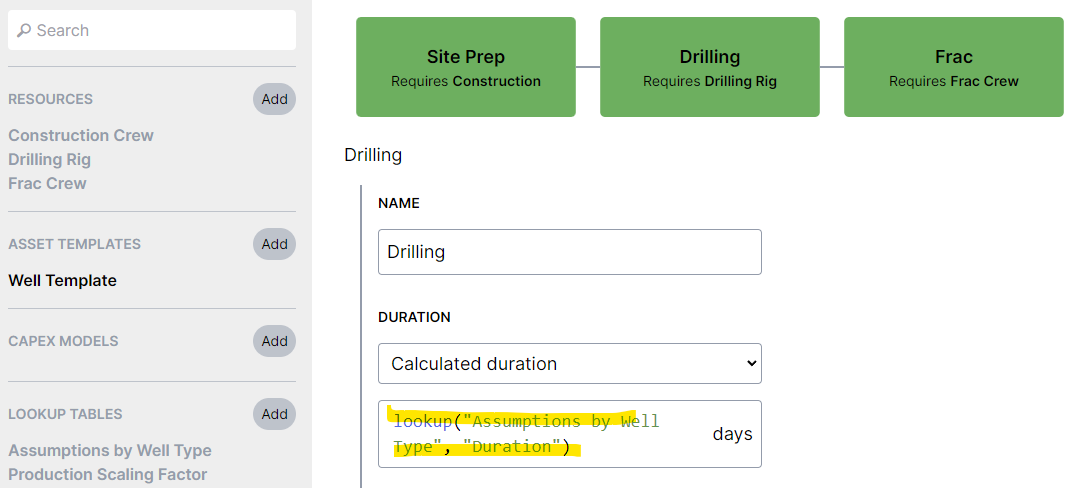
Once you've set up a lookup table, you can use it from any formula using the new lookup function. For example, using the lookup table in the screenshot above, you could look up the value column named "Duration" by writing a formula like lookup("Assumptions by Well Type", "Duration"). This would use the well's "Well Type" attribute to find a matching row, then find the duration in that row. In this case, a well with a "Well Type" of "B" would lookup a drilling duration of "10".
|
If you use a number attribute to look up a number value, values will automatically be interpolated. For example, this can be really useful to use lateral length to interpolate values like duration or scaling factors.
You can build your lookup tables directly in the Planner if you'd like, or you can import them in bulk through a new Import lookup tables option in the Excel import:
|

There are some comments in the template that explain how to use it, but generally it matches what you'd see in the Planner lookup table editor.
➗ Formula editor
With the lookup function being added, it seemed like the right time to start listing all attributes and functions in the editor. When you start typing an attribute or function name, or if use the hotkey (Ctrl-Space) while editing a formula, you'll see a list of all matching attributes/functions with descriptions:
|
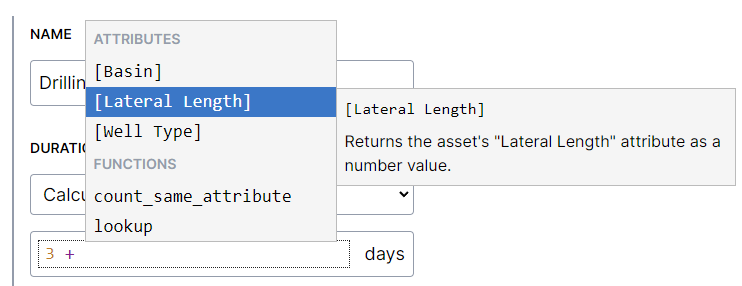
If you click on one of these or hit enter while its selected, then it will insert that attribute/function into the editor. This should make it easier to build functions in general, but will eventually become a complete function reference as more functions are added.
The descriptions also stay active while you're editing the formula, so it's easy to reference in case you forget what a specific function does, or how the function is supposed to be used.
The formula editor will also automatically expand to multiple lines when necessary, so its much easier to write longer formulas:
|

📋 Excel import/export improvements
The Excel header import is a really common way to bulk import plan inputs, so this release improves that experience even more:
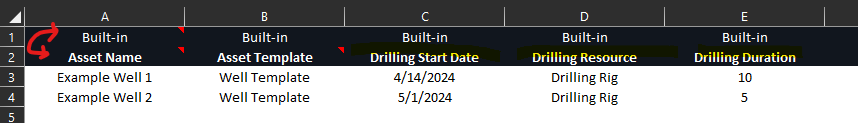
- If you'd like to override activity dates or durations in bulk (e.g., schedule actuals), there's now a convenient way to do that. You can now add activity columns to the header import to import activity start dates, resources, and durations per well (pictured below).
- For the header import, you can now swap the header rows (column name and type) if you'd like (also pictured below). This makes it much easier to use directly with Excel tables.
- The Planner always tries its best to avoid making you wait, so this release improved the header import performance. The header import should feel much faster for larger plans.
|
The schedule export also had some changes to make it easier to QC or quickly drop schedule results into your favorite BI tools.
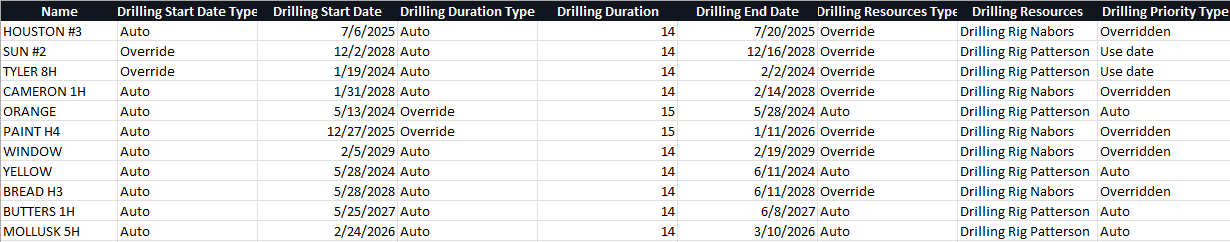
The schedule export now includes columns to indicate whether inputs are auto (calculated automatically) or overridden (manually changed). This release also also adds an end date column (equivalent to adding the duration to the start date), which makes it easier to use end dates directly instead of having to do the calculation yourself. A column named "Priority Type" was also added, so you can easily tell whether this activity will be scheduled using the start date ("Use date") or using a priority that was assigned to it through the new planning mode ("Overridden").
Here's what the schedule export looks like now:
|
🤏 Schedule view usability
Having trouble sharing your schedule on a single screen? You can now control the row height of your schedule under the "Display" dropdown. So much room for activities!
|
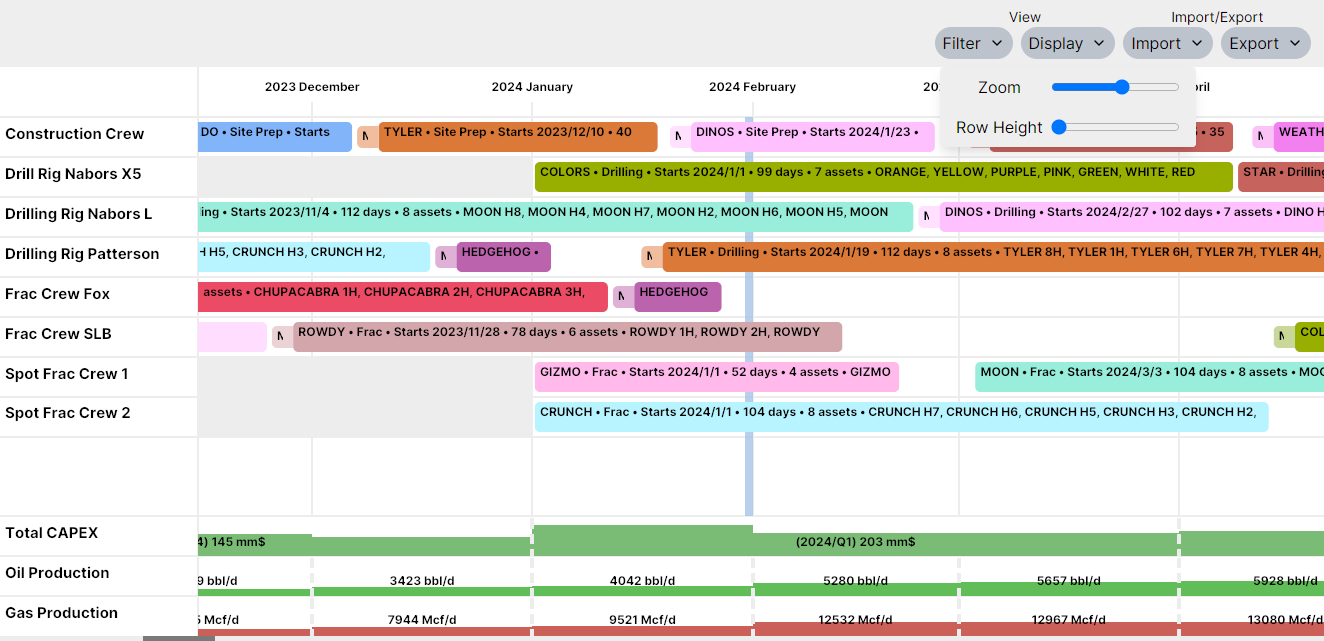
More seriously though, this was a popular request for plans with many resources that wanted to avoid having to vertically scroll frequently (even after hiding certain resources from the schedule view). Currently the row heights apply to both resources and metrics, but eventually this will probably be split out further (e.g., change height for a specific resource).
This release also changes how overlapping activities are handled. Sometimes activities happen simultaneously intentionally and you want to be able to see them separately, or maybe you want to place an activity on top of another temporarily while you make room for it somewhere else. Either way, we wanted it to be easier to see and interact with those overlapping activities. This release will automatically expand the height of a resource to accommodate anything that's scheduled simultaneously:
|
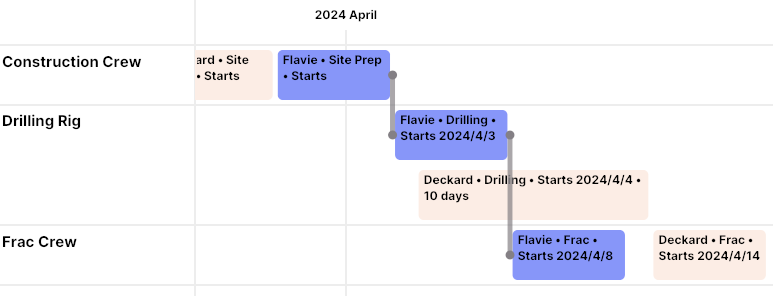
This release also changes how relationship lines are drawn between activities. Previously if you selected an activity, it would only draw relationships to activities immediately before or after it. Now it will draw all relationships that are related to the asset.
For example, in the screenshot below, clicking on "Frac" will also draw a line from "Site Prep" to "Drilling", because they're all related to the same asset:
|
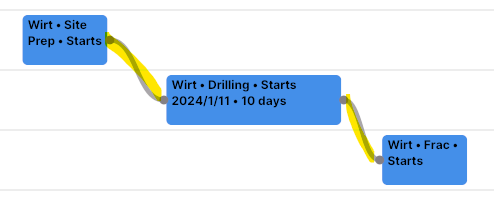
This makes it easier to see the entire lifecycle of one asset by clicking on any activity related to it, or more easily troubleshoot why an activity is placed on a certain date because of its relationships.
This release also reduced the loading times for the Schedule tab. It should feel noticeably faster when quickly jumping between tabs to view your schedule.
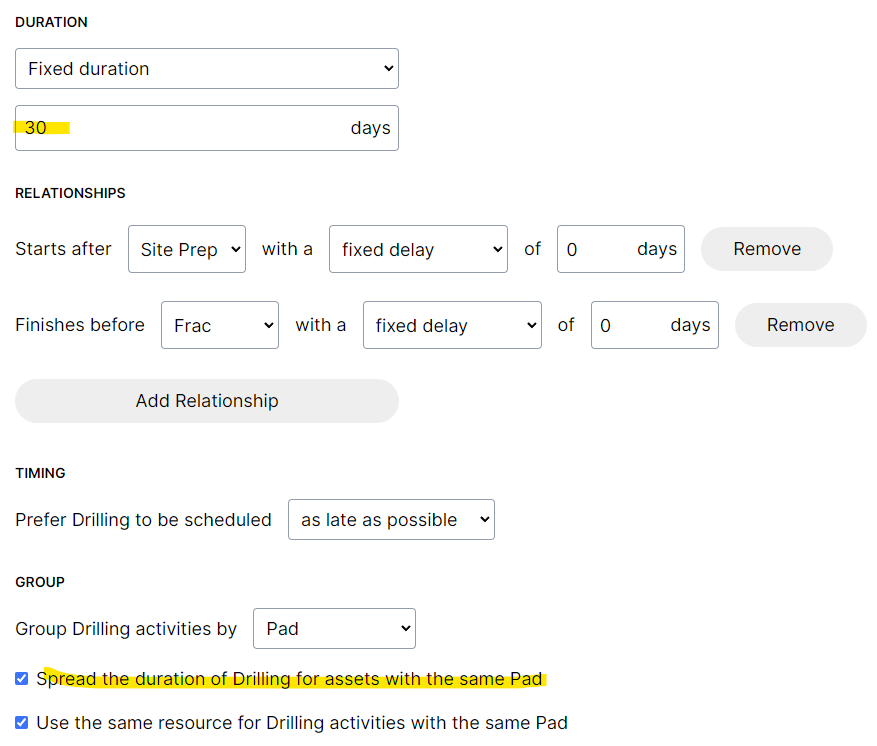
🔗 Spread a group duration across wells
Sometimes you might want to define activity durations at a group level instead of per-well. For example, "the total frac duration for this pad should be 30 days". Previously the only way to do this was to manually spread the duration across the wells, so in that example a 5-well pad might each end up with 6 days (30 / 5).
The new release makes this much easier by spreading group durations automatically. You can enter activity durations as usual but using a the duration for the entire group. Afterwards you can specify that you want the duration to be spread across the group with the new checkbox:
|
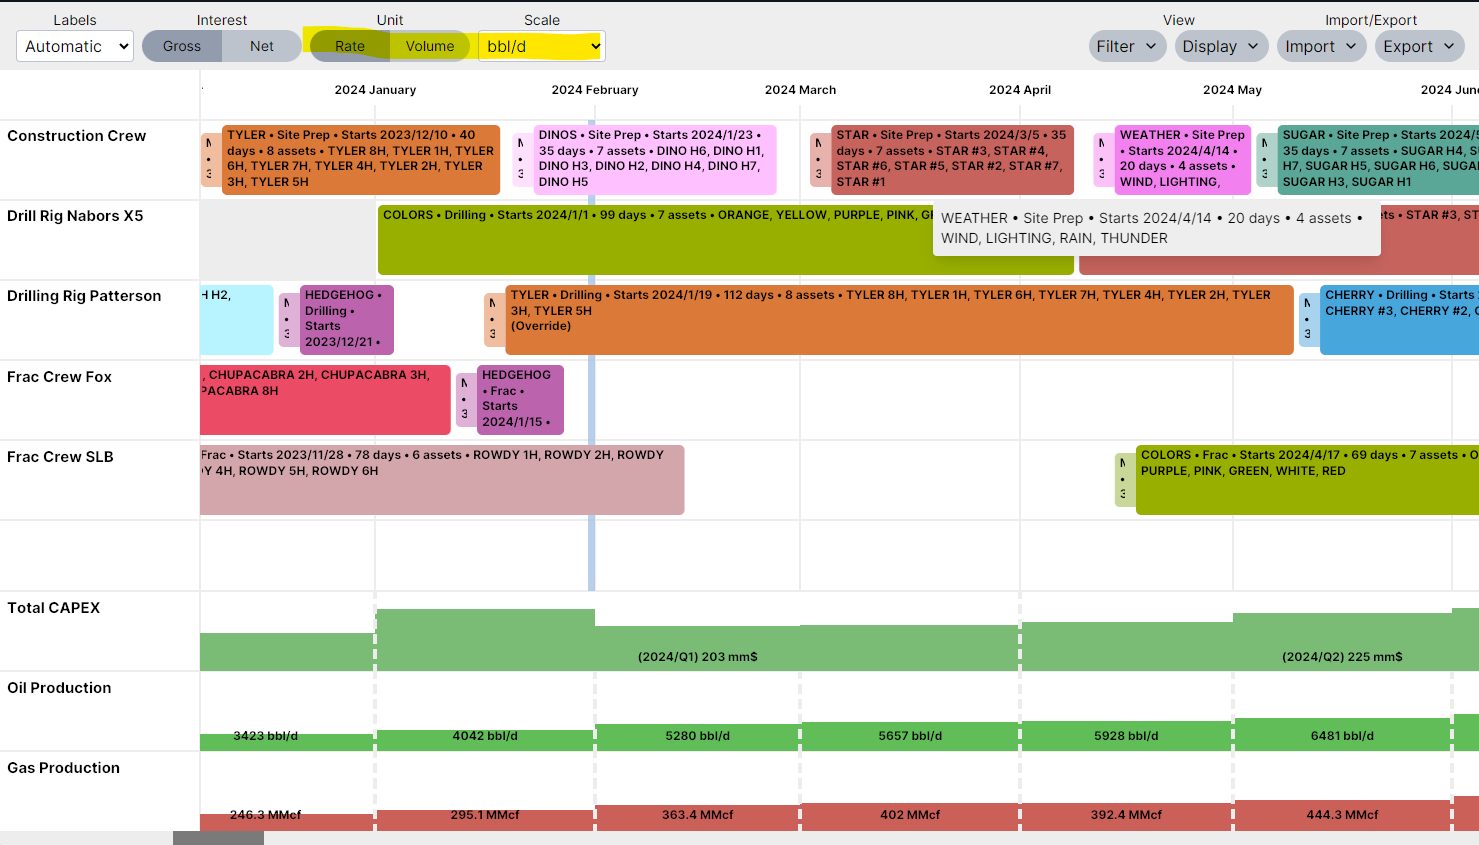
📊 Change units for production metrics
Previously production metrics were always displayed in volume units at a default scale. This works fine if you're used to working in volumes, but sometimes you want to see metrics in rates instead, or customize the scale to be more reasonable based on total amount of production in your plan.
The new release makes it possible to switch production units from the metric settings. You can click on a metric and select the type (rate or volume) and scale to use.
|
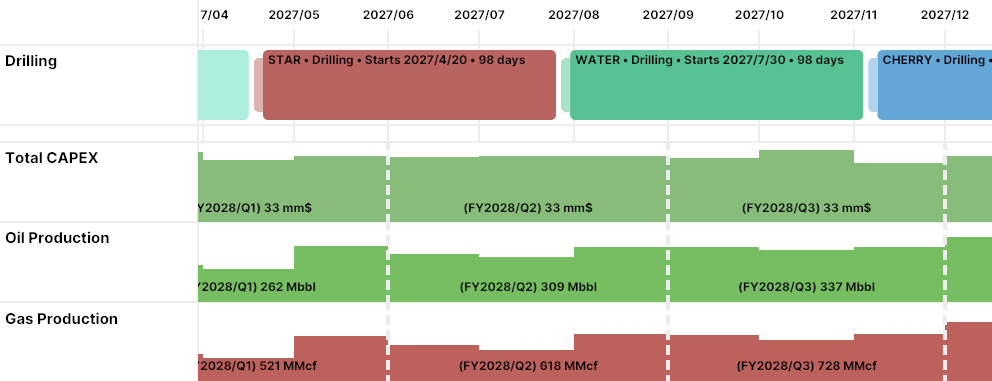
📅 Fiscal year
Quarterly or yearly metrics aren't as useful if you're using a fiscal year that doesn't align with the calendar year. This release makes it possible to set the economic basis to use for your fiscal year under "Settings" then "Economics":
|
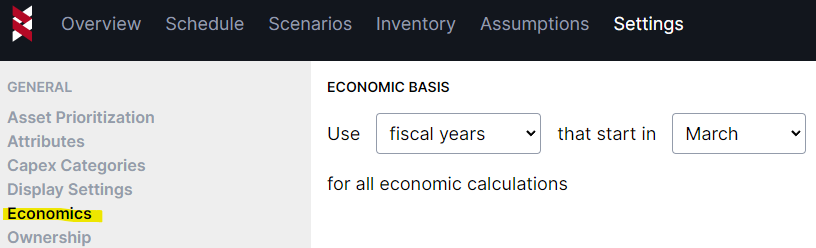
Then fiscal quarters and fiscal years will be used based on the start month that you set:
|